## Description
This PR upgrades Prettier to v2 + enforces TypeScript’s [`import
type`](https://www.typescriptlang.org/docs/handbook/release-notes/typescript-3-8.html#type-only-imports-and-export)
syntax where applicable. It’s submitted as a separate PR so we can merge
it easily.
As a part of this PR, we reformat the codebase heavily:
- add `import type` everywhere where it’s required, and
- re-format the code to account for Prettier 2’s breaking changes:
https://prettier.io/blog/2020/03/21/2.0.0.html#breaking-changes
This PR is submitted against `release` to make sure all new code by team
members will adhere to new formatting standards, and we’ll have fewer
conflicts when merging `bundle-optimizations` into `release`. (I’ll
merge `release` back into `bundle-optimizations` once this PR is
merged.)
### Why is this needed?
This PR is needed because, for the Lodash optimization from
7cbb12af88,
we need to use `import type`. Otherwise, `babel-plugin-lodash` complains
that `LoDashStatic` is not a lodash function.
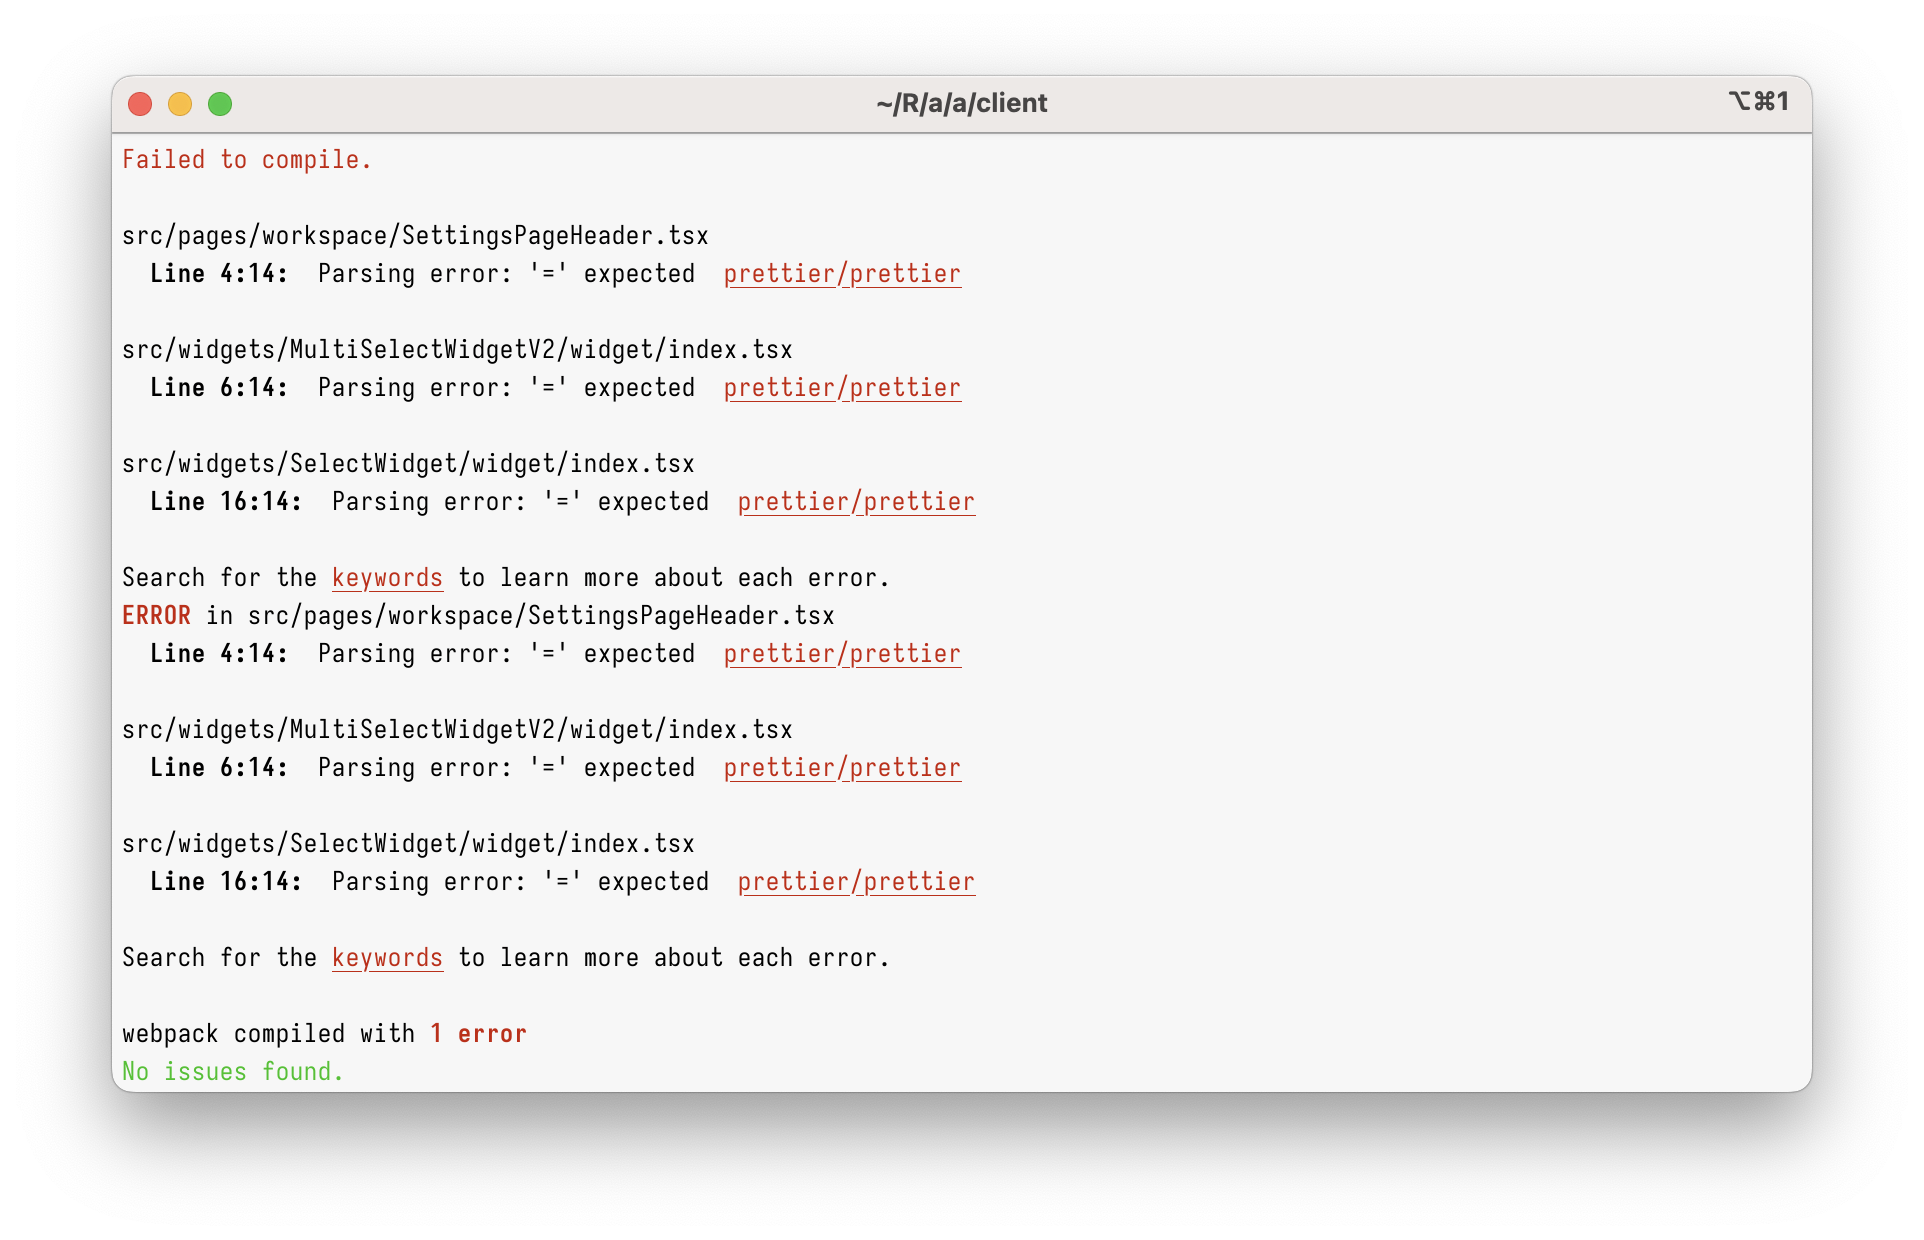
However, just using `import type` in the current codebase will give you
this:
<img width="962" alt="Screenshot 2023-03-08 at 17 45 59"
src="https://user-images.githubusercontent.com/2953267/223775744-407afa0c-e8b9-44a1-90f9-b879348da57f.png">
That’s because Prettier 1 can’t parse `import type` at all. To parse it,
we need to upgrade to Prettier 2.
### Why enforce `import type`?
Apart from just enabling `import type` support, this PR enforces
specifying `import type` everywhere it’s needed. (Developers will get
immediate TypeScript and ESLint errors when they forget to do so.)
I’m doing this because I believe `import type` improves DX and makes
refactorings easier.
Let’s say you had a few imports like below. Can you tell which of these
imports will increase the bundle size? (Tip: it’s not all of them!)
```ts
// app/client/src/workers/Linting/utils.ts
import { Position } from "codemirror";
import { LintError as JSHintError, LintOptions } from "jshint";
import { get, isEmpty, isNumber, keys, last, set } from "lodash";
```
It’s pretty hard, right?
What about now?
```ts
// app/client/src/workers/Linting/utils.ts
import type { Position } from "codemirror";
import type { LintError as JSHintError, LintOptions } from "jshint";
import { get, isEmpty, isNumber, keys, last, set } from "lodash";
```
Now, it’s clear that only `lodash` will be bundled.
This helps developers to see which imports are problematic, but it
_also_ helps with refactorings. Now, if you want to see where
`codemirror` is bundled, you can just grep for `import \{.*\} from
"codemirror"` – and you won’t get any type-only imports.
This also helps (some) bundlers. Upon transpiling, TypeScript erases
type-only imports completely. In some environment (not ours), this makes
the bundle smaller, as the bundler doesn’t need to bundle type-only
imports anymore.
## Type of change
- Chore (housekeeping or task changes that don't impact user perception)
## How Has This Been Tested?
This was tested to not break the build.
### Test Plan
> Add Testsmith test cases links that relate to this PR
### Issues raised during DP testing
> Link issues raised during DP testing for better visiblity and tracking
(copy link from comments dropped on this PR)
## Checklist:
### Dev activity
- [x] My code follows the style guidelines of this project
- [ ] I have performed a self-review of my own code
- [ ] I have commented my code, particularly in hard-to-understand areas
- [ ] I have made corresponding changes to the documentation
- [x] My changes generate no new warnings
- [ ] I have added tests that prove my fix is effective or that my
feature works
- [ ] New and existing unit tests pass locally with my changes
- [ ] PR is being merged under a feature flag
### QA activity:
- [ ] Test plan has been approved by relevant developers
- [ ] Test plan has been peer reviewed by QA
- [ ] Cypress test cases have been added and approved by either SDET or
manual QA
- [ ] Organized project review call with relevant stakeholders after
Round 1/2 of QA
- [ ] Added Test Plan Approved label after reveiwing all Cypress test
---------
Co-authored-by: Satish Gandham <hello@satishgandham.com>
Co-authored-by: Satish Gandham <satish.iitg@gmail.com>
524 lines
14 KiB
TypeScript
524 lines
14 KiB
TypeScript
import { get } from "lodash";
|
|
import equal from "fast-deep-equal/es6";
|
|
import React from "react";
|
|
import styled from "styled-components";
|
|
|
|
import { invisible } from "constants/DefaultTheme";
|
|
import { getAppsmithConfigs } from "@appsmith/configs";
|
|
import type {
|
|
ChartDataPoint,
|
|
ChartType,
|
|
CustomFusionChartConfig,
|
|
AllChartData,
|
|
ChartSelectedDataPoint,
|
|
} from "../constants";
|
|
import {
|
|
LabelOrientation,
|
|
LABEL_ORIENTATION_COMPATIBLE_CHARTS,
|
|
} from "../constants";
|
|
import { getSeriesChartData } from "./utils";
|
|
import log from "loglevel";
|
|
import { Colors } from "constants/Colors";
|
|
// Leaving this require here. Ref: https://stackoverflow.com/questions/41292559/could-not-find-a-declaration-file-for-module-module-name-path-to-module-nam/42505940#42505940
|
|
// FusionCharts comes with its own typings so there is no need to separately import them. But an import from fusioncharts/core still requires a declaration file.
|
|
const FusionCharts = require("fusioncharts");
|
|
const plugins: Record<string, any> = {
|
|
Charts: require("fusioncharts/fusioncharts.charts"),
|
|
FusionTheme: require("fusioncharts/themes/fusioncharts.theme.fusion"),
|
|
Widgets: require("fusioncharts/fusioncharts.widgets"),
|
|
ZoomScatter: require("fusioncharts/fusioncharts.zoomscatter"),
|
|
ZoomLine: require("fusioncharts/fusioncharts.zoomline"),
|
|
PowerCharts: require("fusioncharts/fusioncharts.powercharts"),
|
|
TimeSeries: require("fusioncharts/fusioncharts.timeseries"),
|
|
OverlappedColumn: require("fusioncharts/fusioncharts.overlappedcolumn2d"),
|
|
OverlappedBar: require("fusioncharts/fusioncharts.overlappedbar2d"),
|
|
TreeMap: require("fusioncharts/fusioncharts.treemap"),
|
|
Maps: require("fusioncharts/fusioncharts.maps"),
|
|
Gantt: require("fusioncharts/fusioncharts.gantt"),
|
|
VML: require("fusioncharts/fusioncharts.vml"),
|
|
};
|
|
|
|
// Enable all plugins.
|
|
// This is needed to support custom chart configs
|
|
Object.keys(plugins).forEach((key: string) =>
|
|
(plugins[key] as any)(FusionCharts),
|
|
);
|
|
|
|
const { fusioncharts } = getAppsmithConfigs();
|
|
FusionCharts.options.license({
|
|
key: fusioncharts.licenseKey,
|
|
creditLabel: false,
|
|
});
|
|
|
|
export interface ChartComponentProps {
|
|
allowScroll: boolean;
|
|
chartData: AllChartData;
|
|
chartName: string;
|
|
chartType: ChartType;
|
|
customFusionChartConfig: CustomFusionChartConfig;
|
|
isVisible?: boolean;
|
|
isLoading: boolean;
|
|
setAdaptiveYMin: boolean;
|
|
labelOrientation?: LabelOrientation;
|
|
onDataPointClick: (selectedDataPoint: ChartSelectedDataPoint) => void;
|
|
widgetId: string;
|
|
xAxisName: string;
|
|
yAxisName: string;
|
|
borderRadius: string;
|
|
boxShadow?: string;
|
|
primaryColor?: string;
|
|
fontFamily?: string;
|
|
}
|
|
|
|
const CanvasContainer = styled.div<
|
|
Omit<ChartComponentProps, "onDataPointClick">
|
|
>`
|
|
border-radius: ${({ borderRadius }) => borderRadius};
|
|
box-shadow: ${({ boxShadow }) => `${boxShadow}`} !important;
|
|
|
|
height: 100%;
|
|
width: 100%;
|
|
background: ${Colors.WHITE};
|
|
overflow: hidden;
|
|
position: relative;
|
|
${(props) => (!props.isVisible ? invisible : "")};
|
|
padding: 10px 0 0 0;
|
|
}`;
|
|
|
|
export const isLabelOrientationApplicableFor = (chartType: string) =>
|
|
LABEL_ORIENTATION_COMPATIBLE_CHARTS.includes(chartType);
|
|
|
|
class ChartComponent extends React.Component<ChartComponentProps> {
|
|
chartInstance = new FusionCharts();
|
|
|
|
chartContainerId = this.props.widgetId + "chart-container";
|
|
|
|
getChartType = () => {
|
|
const { allowScroll, chartData, chartType } = this.props;
|
|
const dataLength = Object.keys(chartData).length;
|
|
const isMSChart = dataLength > 1;
|
|
switch (chartType) {
|
|
case "PIE_CHART":
|
|
return "pie2d";
|
|
case "LINE_CHART":
|
|
return allowScroll ? "scrollline2d" : isMSChart ? "msline" : "line";
|
|
case "BAR_CHART":
|
|
return allowScroll ? "scrollBar2D" : isMSChart ? "msbar2d" : "bar2d";
|
|
case "AREA_CHART":
|
|
return allowScroll ? "scrollarea2d" : isMSChart ? "msarea" : "area2d";
|
|
case "COLUMN_CHART":
|
|
return allowScroll
|
|
? "scrollColumn2D"
|
|
: isMSChart
|
|
? "mscolumn2d"
|
|
: "column2d";
|
|
default:
|
|
return allowScroll ? "scrollColumn2D" : "mscolumn2d";
|
|
}
|
|
};
|
|
|
|
getChartData = () => {
|
|
const chartData: AllChartData = this.props.chartData;
|
|
const dataLength = Object.keys(chartData).length;
|
|
const chartType = this.props.chartType;
|
|
|
|
// if datalength is zero, just pass a empty datum
|
|
if (dataLength === 0) {
|
|
return [
|
|
{
|
|
label: "",
|
|
value: "",
|
|
},
|
|
];
|
|
}
|
|
|
|
const firstKey = Object.keys(chartData)[0] as string;
|
|
let data = get(chartData, `${firstKey}.data`, []) as ChartDataPoint[];
|
|
const color = chartData[firstKey] && chartData[firstKey].color;
|
|
|
|
if (!Array.isArray(data)) {
|
|
data = [];
|
|
}
|
|
|
|
if (data.length === 0) {
|
|
return [
|
|
{
|
|
label: "",
|
|
value: "",
|
|
},
|
|
];
|
|
}
|
|
|
|
return data.map((item) => {
|
|
return {
|
|
label: item.x,
|
|
value: item.y,
|
|
color:
|
|
chartType === "PIE_CHART"
|
|
? ""
|
|
: color
|
|
? color
|
|
: this.props.primaryColor,
|
|
};
|
|
});
|
|
};
|
|
|
|
getChartCategoriesMultiSeries = (chartData: AllChartData) => {
|
|
const categories: string[] = [];
|
|
|
|
Object.keys(chartData).forEach((key: string) => {
|
|
let data = get(chartData, `${key}.data`, []) as ChartDataPoint[];
|
|
|
|
if (!Array.isArray(data)) {
|
|
data = [];
|
|
}
|
|
|
|
for (let dataIndex = 0; dataIndex < data.length; dataIndex++) {
|
|
const category = data[dataIndex].x;
|
|
if (!categories.includes(category)) {
|
|
categories.push(category);
|
|
}
|
|
}
|
|
});
|
|
|
|
return categories;
|
|
};
|
|
|
|
getChartCategories = (chartData: AllChartData) => {
|
|
const categories: string[] = this.getChartCategoriesMultiSeries(chartData);
|
|
|
|
if (categories.length === 0) {
|
|
return [
|
|
{
|
|
label: "",
|
|
},
|
|
];
|
|
}
|
|
return categories.map((item) => {
|
|
return {
|
|
label: item,
|
|
};
|
|
});
|
|
};
|
|
|
|
/**
|
|
* creates dataset need by fusion chart from widget object-data
|
|
*
|
|
* @param chartData
|
|
* @returns
|
|
*/
|
|
getChartDataset = (chartData: AllChartData) => {
|
|
const categories: string[] = this.getChartCategoriesMultiSeries(chartData);
|
|
|
|
const dataset = Object.keys(chartData).map((key: string, index) => {
|
|
const item = get(chartData, `${key}`);
|
|
|
|
const seriesChartData: Array<Record<string, unknown>> =
|
|
getSeriesChartData(get(item, "data", []), categories);
|
|
return {
|
|
seriesName: item.seriesName,
|
|
color: item.color
|
|
? item.color
|
|
: index === 0
|
|
? this.props.primaryColor
|
|
: "",
|
|
data: seriesChartData,
|
|
};
|
|
});
|
|
|
|
return dataset;
|
|
};
|
|
|
|
getLabelOrientationConfig = () => {
|
|
switch (this.props.labelOrientation) {
|
|
case LabelOrientation.AUTO:
|
|
return {};
|
|
case LabelOrientation.ROTATE:
|
|
return {
|
|
labelDisplay: "rotate",
|
|
slantLabel: "0",
|
|
};
|
|
case LabelOrientation.SLANT:
|
|
return {
|
|
labelDisplay: "rotate",
|
|
slantLabel: "1",
|
|
};
|
|
case LabelOrientation.STAGGER:
|
|
return {
|
|
labelDisplay: "stagger",
|
|
};
|
|
default: {
|
|
return {};
|
|
}
|
|
}
|
|
};
|
|
|
|
getChartConfig = () => {
|
|
const isSingleSeriesData = this.getDatalength() === 1 ? true : false;
|
|
const paletteColorConfig = isSingleSeriesData &&
|
|
this.props.chartType !== "PIE_CHART" && {
|
|
palettecolors: [this.props.primaryColor],
|
|
};
|
|
|
|
const fontFamily =
|
|
this.props.fontFamily === "System Default"
|
|
? "inherit"
|
|
: this.props.fontFamily;
|
|
|
|
const canvasPadding =
|
|
this.props.chartType === "LINE_CHART"
|
|
? {
|
|
canvasLeftPadding: "5",
|
|
canvasTopPadding: "0",
|
|
canvasRightPadding: "5",
|
|
canvasBottomPadding: "0",
|
|
}
|
|
: {
|
|
canvasPadding: "0",
|
|
};
|
|
|
|
let config = {
|
|
caption: this.props.chartName,
|
|
xAxisName: this.props.xAxisName,
|
|
yAxisName: this.props.yAxisName,
|
|
theme: "fusion",
|
|
alignCaptionWithCanvas: 1,
|
|
|
|
// Caption styling =======================
|
|
captionFontSize: "24",
|
|
captionAlignment: "center",
|
|
captionPadding: "20",
|
|
captionFontColor: Colors.THUNDER,
|
|
|
|
// legend position styling ==========
|
|
legendIconSides: "4",
|
|
legendIconBgAlpha: "100",
|
|
legendIconAlpha: "100",
|
|
legendItemFont: fontFamily,
|
|
legendPosition: "top",
|
|
valueFont: fontFamily,
|
|
|
|
// Canvas styles ========
|
|
...canvasPadding,
|
|
|
|
// Chart styling =======
|
|
chartLeftMargin: "20",
|
|
chartTopMargin: "10",
|
|
chartRightMargin: "40",
|
|
chartBottomMargin: "10",
|
|
|
|
// Axis name styling ======
|
|
xAxisNameFontSize: "14",
|
|
labelFontSize: "12",
|
|
labelFontColor: Colors.DOVE_GRAY2,
|
|
xAxisNameFontColor: Colors.DOVE_GRAY2,
|
|
|
|
yAxisNameFontSize: "14",
|
|
yAxisValueFontSize: "12",
|
|
yAxisValueFontColor: Colors.DOVE_GRAY2,
|
|
yAxisNameFontColor: Colors.DOVE_GRAY2,
|
|
|
|
// Base configurations ======
|
|
baseFont: fontFamily,
|
|
...paletteColorConfig,
|
|
bgColor: Colors.WHITE,
|
|
setAdaptiveYMin: this.props.setAdaptiveYMin ? "1" : "0",
|
|
};
|
|
|
|
if (isLabelOrientationApplicableFor(this.props.chartType)) {
|
|
config = {
|
|
...config,
|
|
...this.getLabelOrientationConfig(),
|
|
};
|
|
}
|
|
|
|
return config;
|
|
};
|
|
|
|
getDatalength = () => {
|
|
return Object.keys(this.props.chartData).length;
|
|
};
|
|
|
|
getChartDataSource = () => {
|
|
const dataLength = this.getDatalength();
|
|
|
|
if (dataLength <= 1 || this.props.chartType === "PIE_CHART") {
|
|
return {
|
|
chart: this.getChartConfig(),
|
|
data: this.getChartData(),
|
|
};
|
|
} else {
|
|
return {
|
|
chart: this.getChartConfig(),
|
|
categories: [
|
|
{
|
|
category: this.getChartCategories(this.props.chartData),
|
|
},
|
|
],
|
|
dataset: this.getChartDataset(this.props.chartData),
|
|
};
|
|
}
|
|
};
|
|
|
|
getCustomFusionChartDataSource = () => {
|
|
// in case of evaluation error, customFusionChartConfig can be undefined
|
|
let config = this.props.customFusionChartConfig as CustomFusionChartConfig;
|
|
if (config && config.dataSource) {
|
|
config = {
|
|
...config,
|
|
dataSource: {
|
|
chart: {
|
|
...config.dataSource.chart,
|
|
caption: this.props.chartName || config.dataSource.chart.caption,
|
|
setAdaptiveYMin: this.props.setAdaptiveYMin ? "1" : "0",
|
|
},
|
|
...config.dataSource,
|
|
},
|
|
};
|
|
}
|
|
return config || {};
|
|
};
|
|
|
|
getScrollChartDataSource = () => {
|
|
const chartConfig = this.getChartConfig();
|
|
|
|
return {
|
|
chart: {
|
|
...chartConfig,
|
|
scrollheight: "10",
|
|
showvalues: "1",
|
|
numVisiblePlot: "5",
|
|
flatScrollBars: "1",
|
|
},
|
|
categories: [
|
|
{
|
|
category: this.getChartCategories(this.props.chartData),
|
|
},
|
|
],
|
|
data: this.getChartData(),
|
|
dataset: this.getChartDataset(this.props.chartData),
|
|
};
|
|
};
|
|
|
|
// return series title name for in clicked data point
|
|
getSeriesTitle = (data: any) => {
|
|
const dataLength = this.getDatalength();
|
|
// if pie chart or other chart have single dataset,
|
|
// get seriesName from chartData
|
|
if (
|
|
(dataLength <= 1 || this.props.chartType === "PIE_CHART") &&
|
|
this.props.chartType !== "CUSTOM_FUSION_CHART"
|
|
) {
|
|
const chartData: AllChartData = this.props.chartData;
|
|
const firstKey = Object.keys(chartData)[0] as string;
|
|
return get(chartData, `${firstKey}.seriesName`, "");
|
|
}
|
|
// other charts return datasetName from clicked data point
|
|
return get(data, "datasetName", "");
|
|
};
|
|
|
|
createGraph = () => {
|
|
if (this.props.chartType === "CUSTOM_FUSION_CHART") {
|
|
const chartConfig = {
|
|
renderAt: this.chartContainerId,
|
|
width: "100%",
|
|
height: "100%",
|
|
events: {
|
|
dataPlotClick: (evt: any) => {
|
|
const data = evt.data;
|
|
const seriesTitle = this.getSeriesTitle(data);
|
|
this.props.onDataPointClick({
|
|
x: data.categoryLabel,
|
|
y: data.dataValue,
|
|
seriesTitle,
|
|
});
|
|
},
|
|
},
|
|
...this.getCustomFusionChartDataSource(),
|
|
};
|
|
this.chartInstance = new FusionCharts(chartConfig);
|
|
return;
|
|
}
|
|
const dataSource =
|
|
this.props.allowScroll && this.props.chartType !== "PIE_CHART"
|
|
? this.getScrollChartDataSource()
|
|
: this.getChartDataSource();
|
|
|
|
const chartConfig = {
|
|
type: this.getChartType(),
|
|
renderAt: this.chartContainerId,
|
|
width: "100%",
|
|
height: "100%",
|
|
dataFormat: "json",
|
|
dataSource: dataSource,
|
|
events: {
|
|
dataPlotClick: (evt: any) => {
|
|
const data = evt.data;
|
|
const seriesTitle = this.getSeriesTitle(data);
|
|
this.props.onDataPointClick({
|
|
x: data.categoryLabel,
|
|
y: data.dataValue,
|
|
seriesTitle,
|
|
});
|
|
},
|
|
},
|
|
};
|
|
|
|
this.chartInstance = new FusionCharts(chartConfig);
|
|
};
|
|
|
|
componentDidMount() {
|
|
this.createGraph();
|
|
FusionCharts.ready(() => {
|
|
/* Component could be unmounted before FusionCharts is ready,
|
|
this check ensure we don't render on unmounted component */
|
|
if (this.chartInstance) {
|
|
try {
|
|
this.chartInstance.render();
|
|
} catch (e) {
|
|
log.error(e);
|
|
}
|
|
}
|
|
});
|
|
}
|
|
|
|
componentWillUnmount() {
|
|
if (this.chartInstance) {
|
|
this.chartInstance = null;
|
|
}
|
|
}
|
|
|
|
componentDidUpdate(prevProps: ChartComponentProps) {
|
|
if (!equal(prevProps, this.props)) {
|
|
const chartType = this.getChartType();
|
|
this.chartInstance.chartType(chartType);
|
|
if (this.props.chartType === "CUSTOM_FUSION_CHART") {
|
|
const { dataSource, type } = this.getCustomFusionChartDataSource();
|
|
this.chartInstance.chartType(type);
|
|
this.chartInstance.setChartData(dataSource);
|
|
} else if (
|
|
this.props.allowScroll &&
|
|
this.props.chartType !== "PIE_CHART"
|
|
) {
|
|
this.chartInstance.setChartData(this.getScrollChartDataSource());
|
|
} else {
|
|
this.chartInstance.setChartData(this.getChartDataSource());
|
|
}
|
|
}
|
|
}
|
|
|
|
render() {
|
|
//eslint-disable-next-line @typescript-eslint/no-unused-vars
|
|
const { onDataPointClick, ...rest } = this.props;
|
|
return (
|
|
<CanvasContainer
|
|
className={this.props.isLoading ? "bp3-skeleton" : ""}
|
|
{...rest}
|
|
id={this.chartContainerId}
|
|
/>
|
|
);
|
|
}
|
|
}
|
|
|
|
export default ChartComponent;
|